
Programming Collective Intelligence - chapter 3 notes
Published: 2014-04-04
Tagged: python readings guide
Chapter 3 of Programming Collective Intelligence (from here on now referred to as The Book) introduces the reader to the idea of data clusters. We tackle two kinds of clusters: hierarchical clusters and k-means clusters. All the code and data needed to run these examples is here and both of the algorithms are in this file.
Hierarchical Clustering
Hierarchical clustering will show us all of the clusters of data at all the levels of granularity. It works by building a tree of nodes. Each end node represents a single item. The two most similar items are merged and become a parent node of the two similar items. We do this until we merge all the parent, grandparent, great-grandparent nodes up until we have no nodes left to merge. This dendrogram presents this process quite well (thanks wikipedia!):

Our clustering algorithm will boil down to these steps:
- Process each item and append it to a list of nodes.
- Process the list, looking for two items which are the most similar.
- Merge the two most similar nodes into a new node.
- Attach these two nodes to the merged node via branches.
- Remove the two nodes from the list of nodes.
- Add the merged node to the list of nodes.
- If len(list) > 0, go to step 1
To measure similarity in this chapter, we'll rely on the Pearson r, however we could go ahead and use other metrics too (euclidean, manhattan, tanimoto).
Each parent cluster will show us a group of similar items. Looking at the graphic above, we can see that items d and e are similar to each other because they have the same parent node. We also see that the group d,e is similar to item f because they have the same parent as well.
If this talk of nodes and trees is confusing you, I highly recommend Data Structures and Algorithms with Object-Oriented Design Patterns in Python. Being able to transform data into trees will be incredibly rewarding in your career of developer/data scientist/others plus it's extremely cool.
K-means Clustering
K-means clustering will show us as many clusters as we want (2 < k < n where n is the number of samples). Having a set of data (say Democrat and Republican supporters)we might go for two clusters. Having all of the supporters, we might want to get three clusters - Democrats, Republicans, Other. In essence, we decide how many clusters we want to obtain.
Having decided on the number of clusters we want (k), we randomly map k many points on the dataset. Then we figure out which data points are closest to one of the points and we move the points to the average point between the closest data points. We repeat this until the points stop moving. Our algorithm will look like this:
- Randomly place k points on dataset.
- Assign the closes points to each k point.
- Move each k point to the average point amongst it's closest points.
- If k had moved, go to step 1.
The figure below (by yours truly) illustrates steps 1-3:

Data gathering
A part of getting information from data is actually getting the data. It was nice and easy back in chapter 2 when we used a dataset built by the good people at grouplens.org, but The Book makes us get our hands dirty and procure the data ourselves this time. The code in <code>generatefeedvector.py</code> uses the feedparser library and a list of 100 URLs to scrape and parse the data. It's also responsible for initially processing the data (word counts) and saving the data into a tab delimited file.
If you're fairly new to Python, giving that file a read will have a good deal of value. I updated the code to work well with Python 2.7.6 and liberally applied a bunch of comments to make it easier to understand. Not only does it show how to pick a good list of words to count, but also shows how to use regular expressions to work with an html document.
Test Drive
Once again, the code is easily usable with an interactive interpreter such as IDLE or IPython. I found that the best way to learn this topic is to run the code and check it out step by step at the same time.
First, lets use hierarchical clustering on the data provided by The Book - scraped word counts of blogs from 2007:
In [1]: import clusters
In [2]: row_names, col_names, data = clusters.read_file('blogdata.txt')
In [3]: tree_root = clusters.hcluster(data)
In [4]: clusters.draw_dendrogram(tree_root, row_names, jpeg='clusters.jpg')
Having done that, you should have a file called clusters.jpg, which should look like this:
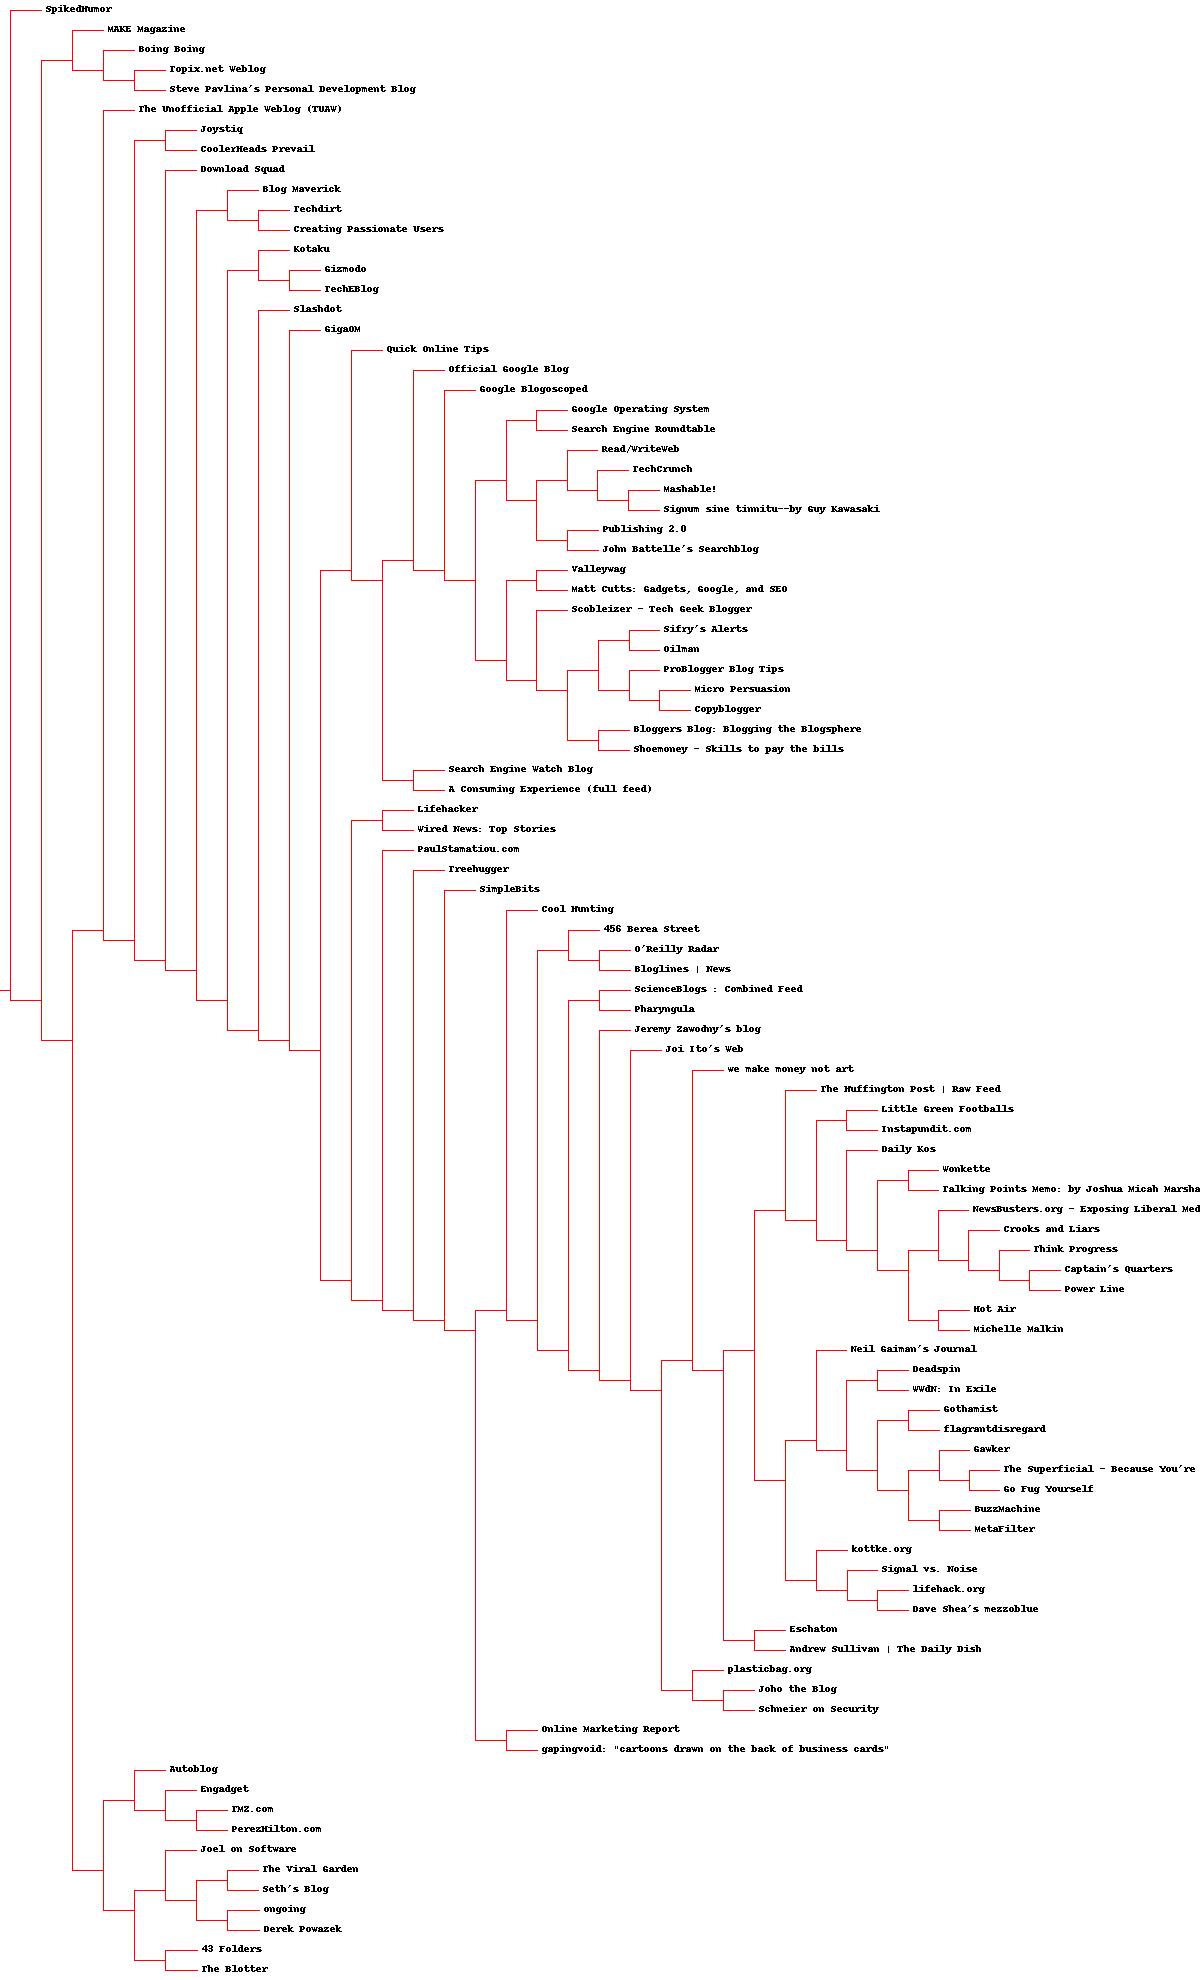
We can easily see that blogs such as ProBlogger Blog Tips and Copyblogger are clustered close together and that Slashdot is similar to a whole bunch of sites and blogs. We also notice a small separate little cluster at the bottom of the graph that groups sites like Joel on Software, Engadget, Seth's blog, 43 Folder and similar ones. Interesting.
I ran the generatefeedvector.py script again out of curiosity and the need to make sure it's working in 2014. Not surprisingly, the results differ from the 2007 results. Check it out yourself.
Now, let's use the k-means function to group our data into 6 clusters. Why 3? Looking at the results from the hierarchical cluster exercise, it seems a good guess as to how many different groups of blogs that list contains.
In [1]: import clusters
In [2]: row_names, col_names, data = clusters.read_file('blogdata.txt')
In [3]: clustered = clusters.kcluster(data, k=3)
Iteration 0
Iteration 1
Iteration 2
Iteration 3
Iteration 4
Iteration 5
Iteration 6
Next I'm using set to only show unique values in a cluster. To investigate a cluster, run it through the row_names like so:
In [10]: set([row_names[i] for i in clustered[1]])
Out[10]:
{'Autoblog',
 'Blog Maverick',
 'CoolerHeads Prevail',
 'Download Squad',
 'Engadget',
 'Joystiq',
 'TMZ.com',
 'TechEBlog',
 'The Blotter',
 'The Unofficial Apple Weblog (TUAW)'}
This seems to correspond to the little cluster at the bottom of the hierarchical cluster dendrogram we saw before. I'll omit the first cluster (clustered[0]) because it's output is pretty long, but the last cluster is interesting:
In [11]: set([row_names[i] for i in clustered[2]])
Out[11]:
{'Andrew Sullivan | The Daily Dish',
 'Boing Boing',
 'BuzzMachine',
 "Captain's Quarters",
 'Crooks and Liars',
 'Daily Kos',
 'Deadspin',
 'Derek Powazek',
 'Eschaton',
 'Gawker',
 'Gizmodo',
 'Go Fug Yourself',
 'Gothamist',
 'Hot Air',
 'Instapundit.com',
 "Jeremy Zawodny's blog",
 'Joel on Software',
 'Kotaku',
 'Little Green Footballs',
 'MetaFilter',
 'Michelle Malkin',
 "Neil Gaiman's Journal",
 'NewsBusters.org - Exposing Liberal Media Bias',
 'PerezHilton.com',
 'Pharyngula',
 'Power Line',
 'Schneier on Security',
 'ScienceBlogs : Combined Feed',
 'SpikedHumor',
 "Steve Pavlina's Personal Development Blog",
 'Talking Points Memo: by Joshua Micah Marshall',
 'The Blotter',
 'The Huffington Post | Raw Feed',
 "The Superficial - Because You're Ugly",
 'Think Progress',
 'WWdN: In Exile',
 'Wonkette',
 'flagrantdisregard',
 'kottke.org',
 'ongoing',
 'plasticbag.org',
 'we make money not art'}
We see that many of these sites are news aggregators dealing with technology. We also see that quite a few of them are personal technical blogs. This overlap could mean one of three things:
- We've chosen the wrong number of clusters.
- The metric we're using (Pearson r) isn't good for this data.
- These sites were all writing about something very similar at that point in time and our results are good.
Notes on possible improvements
The code from this chapter is a great illustration just how far you can get with pure Python. We were able to do pretty much all of our work using Python internals except for the feedparser library and and PIL (used for the dendrograms).
However, the Python landscape has changed a lot from 2007 and here's a few suggestions I have for improving this code:
Graphing - pygraphviz and some docs for making awesome tree graphs.
Data handling - Numpy/Pandas. Everything from numpy.array to pandas.DataFrame would make this code more compact and faster.
Scraping - lxml/BeautifulSoup - much easier to extract what interests us from xml/html.
Metrics - scipy. Just look at these functions. There's everything from manhattan distance to euclidean distance and more.
Comments